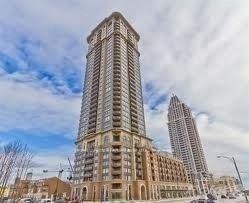
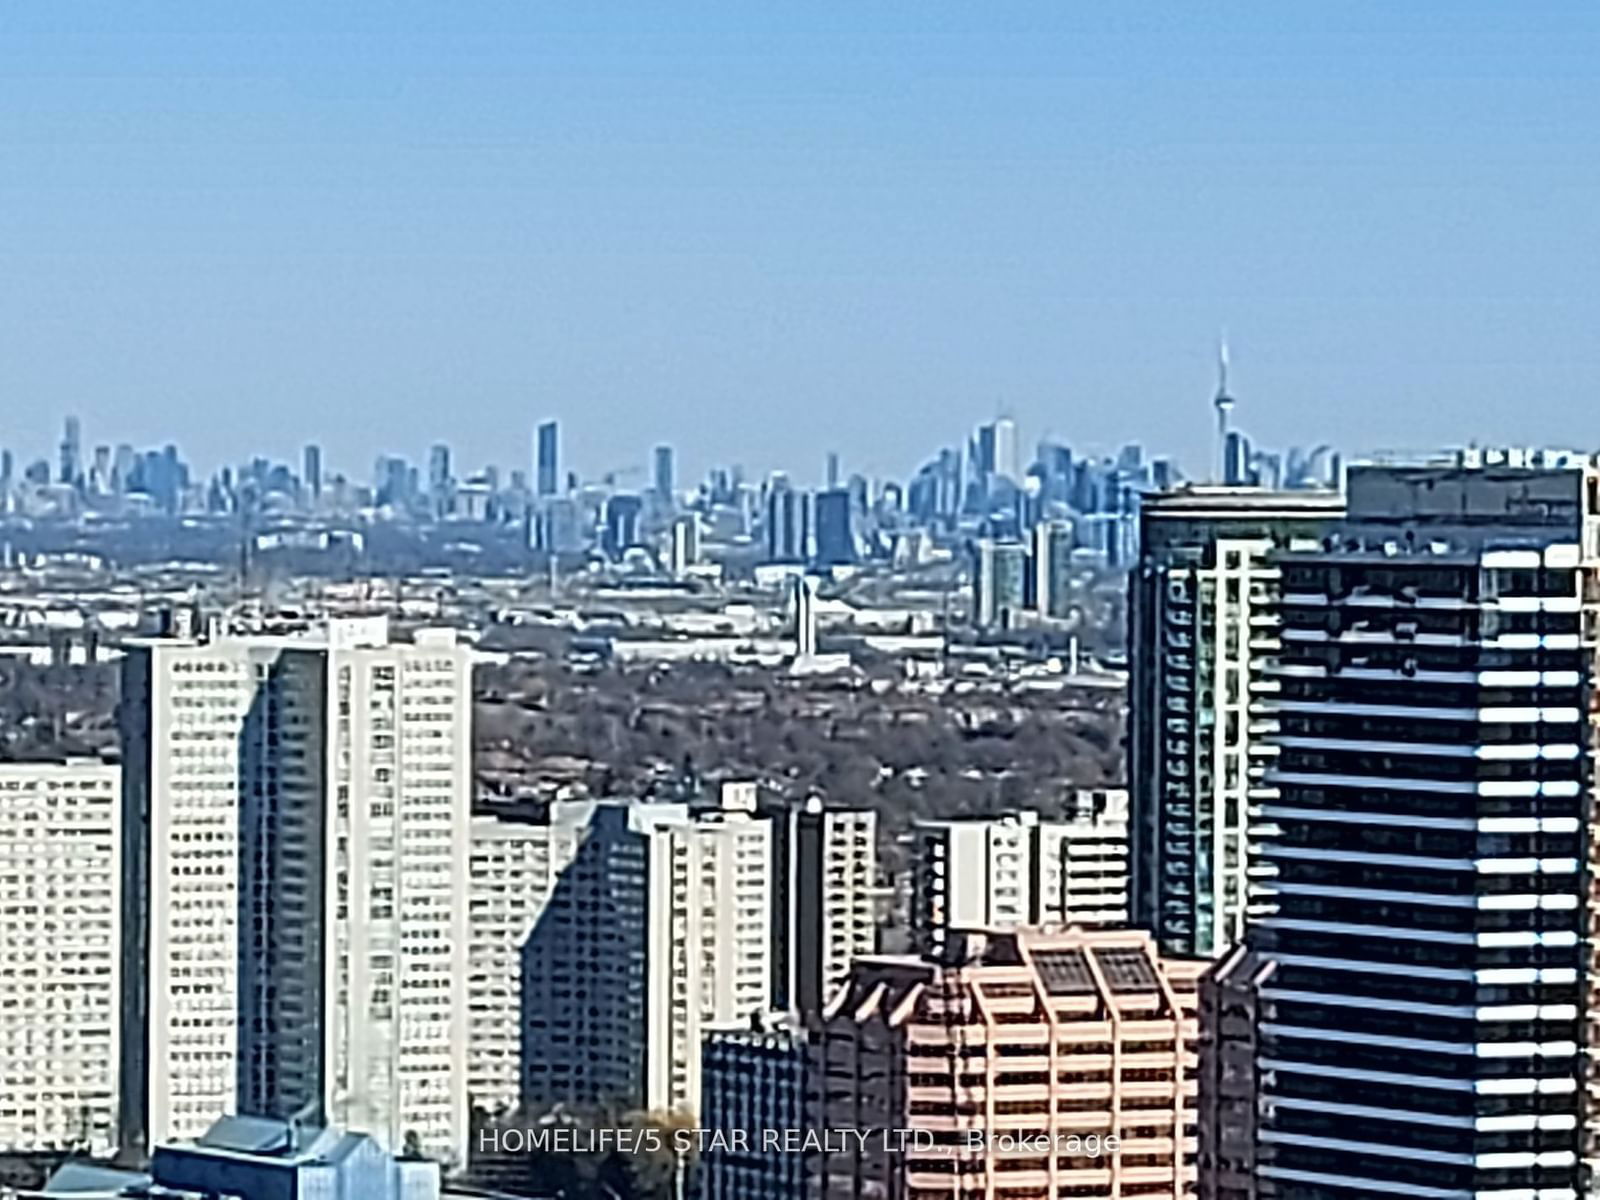
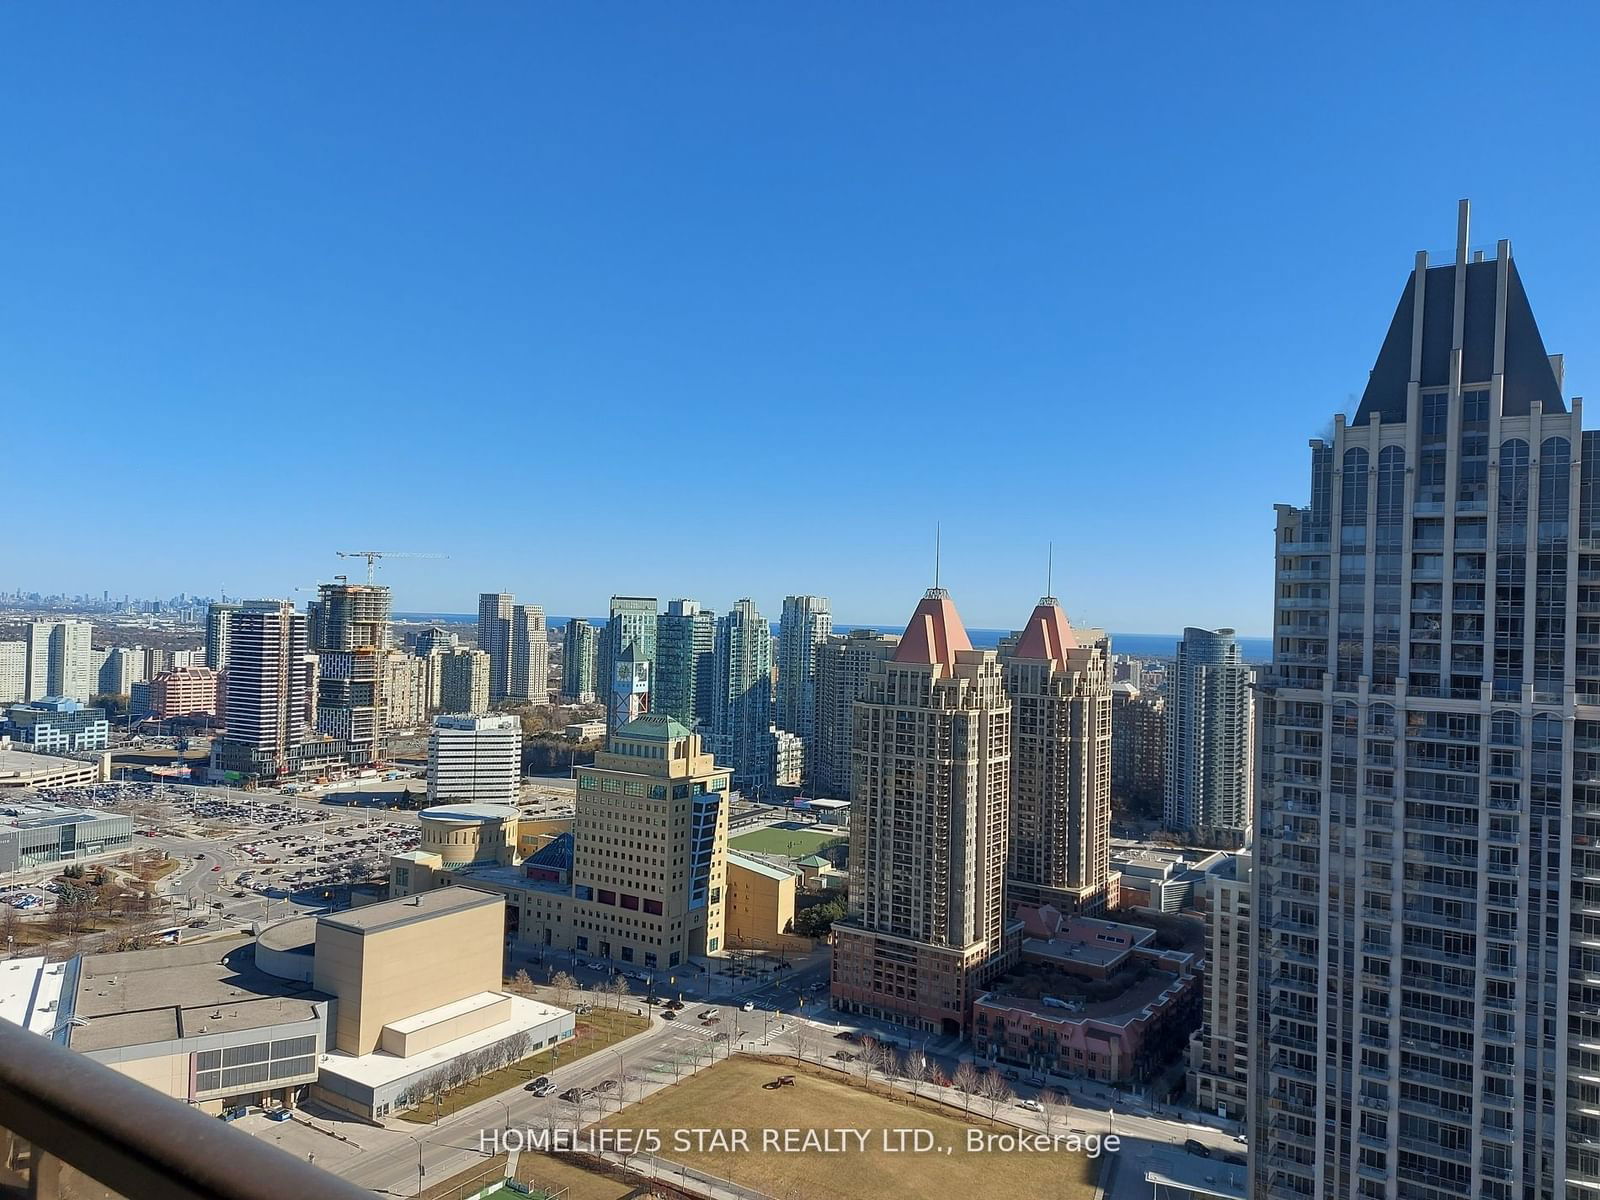
3307 - 385 Prince Of Wales Dr
Listing History
Unit Highlights
Utilities Included
Utility Type
- Air Conditioning
- Central Air
- Heat Source
- No Data
- Heating
- Forced Air
Room Dimensions
About this Listing
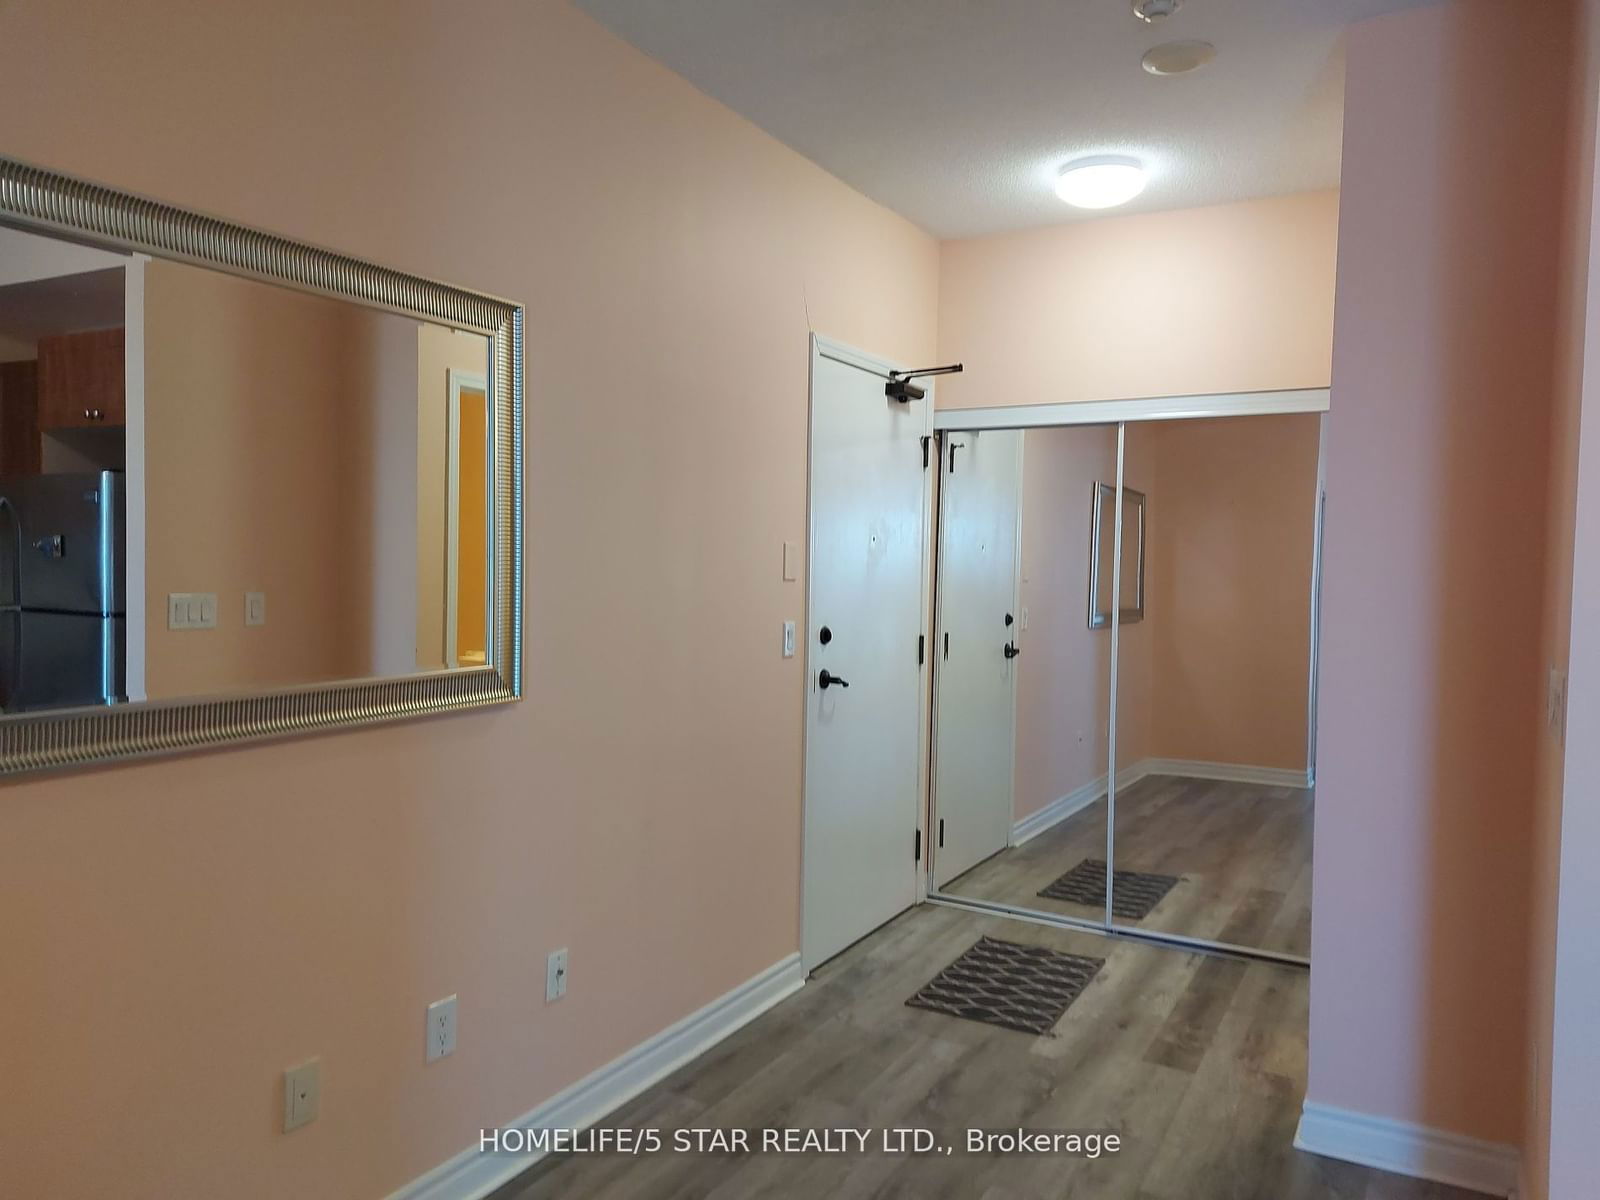
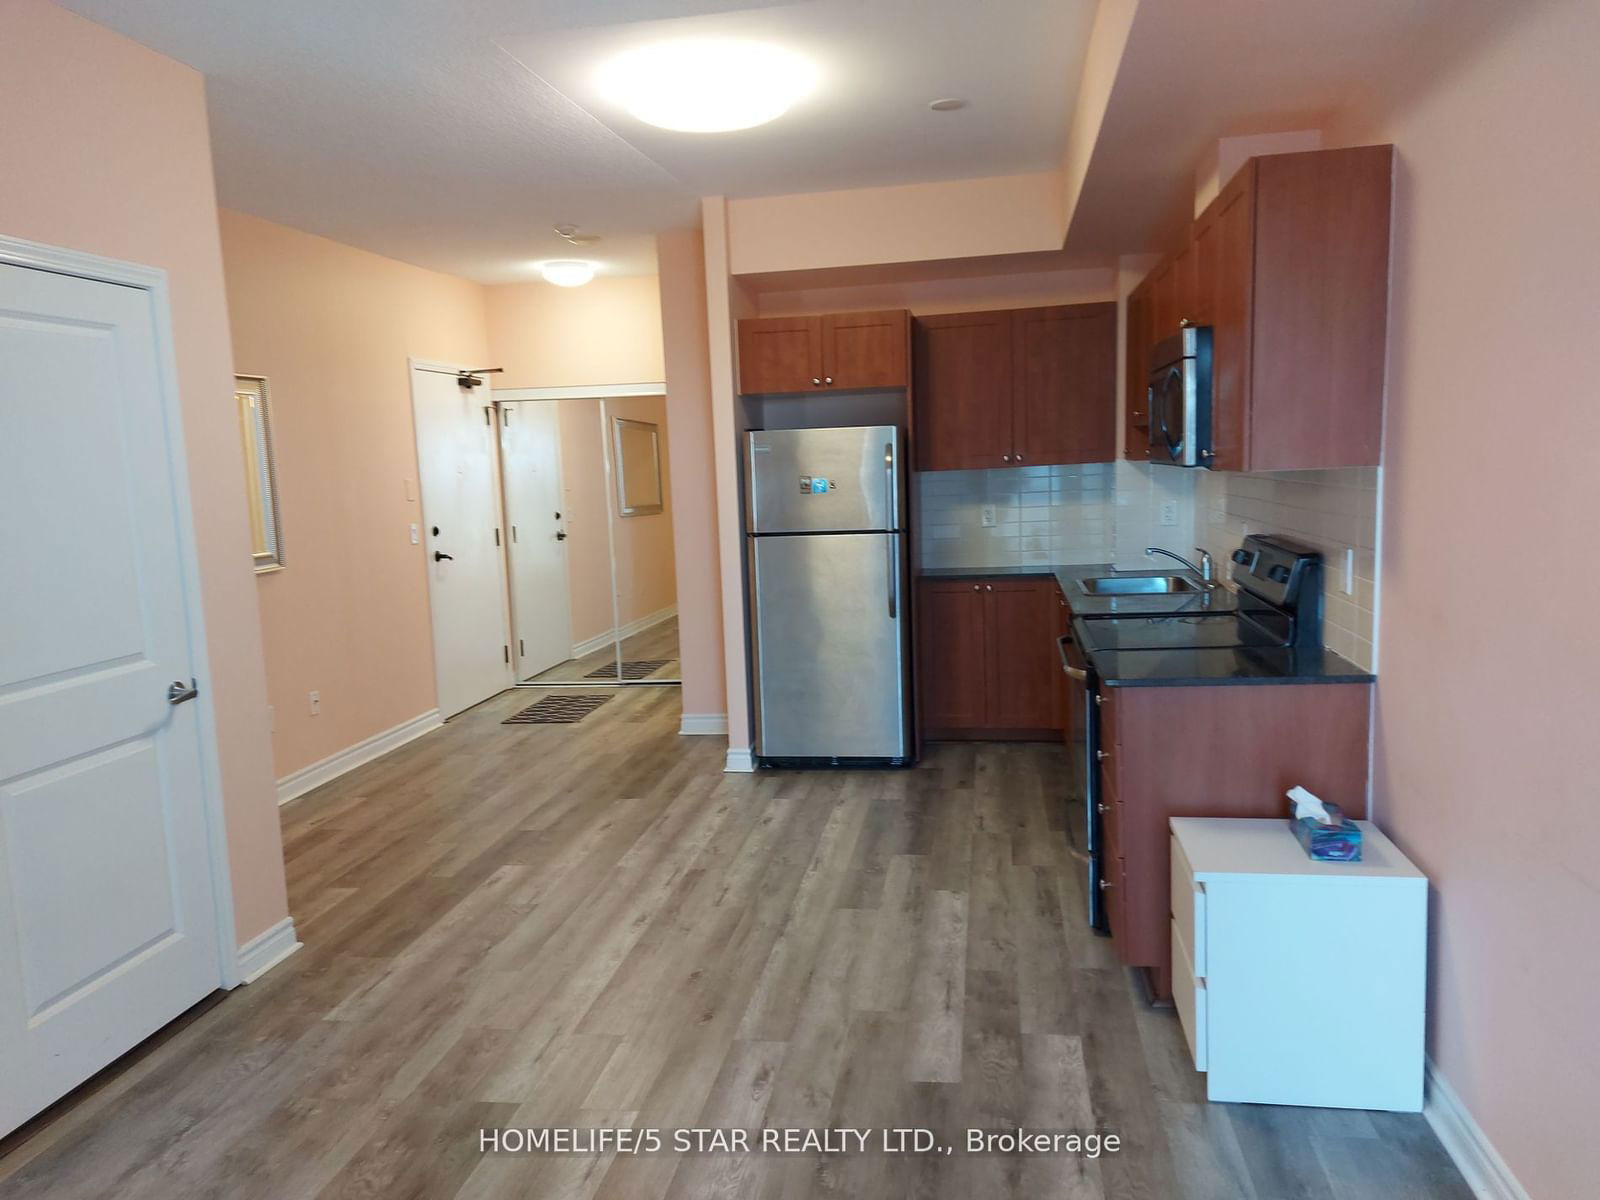
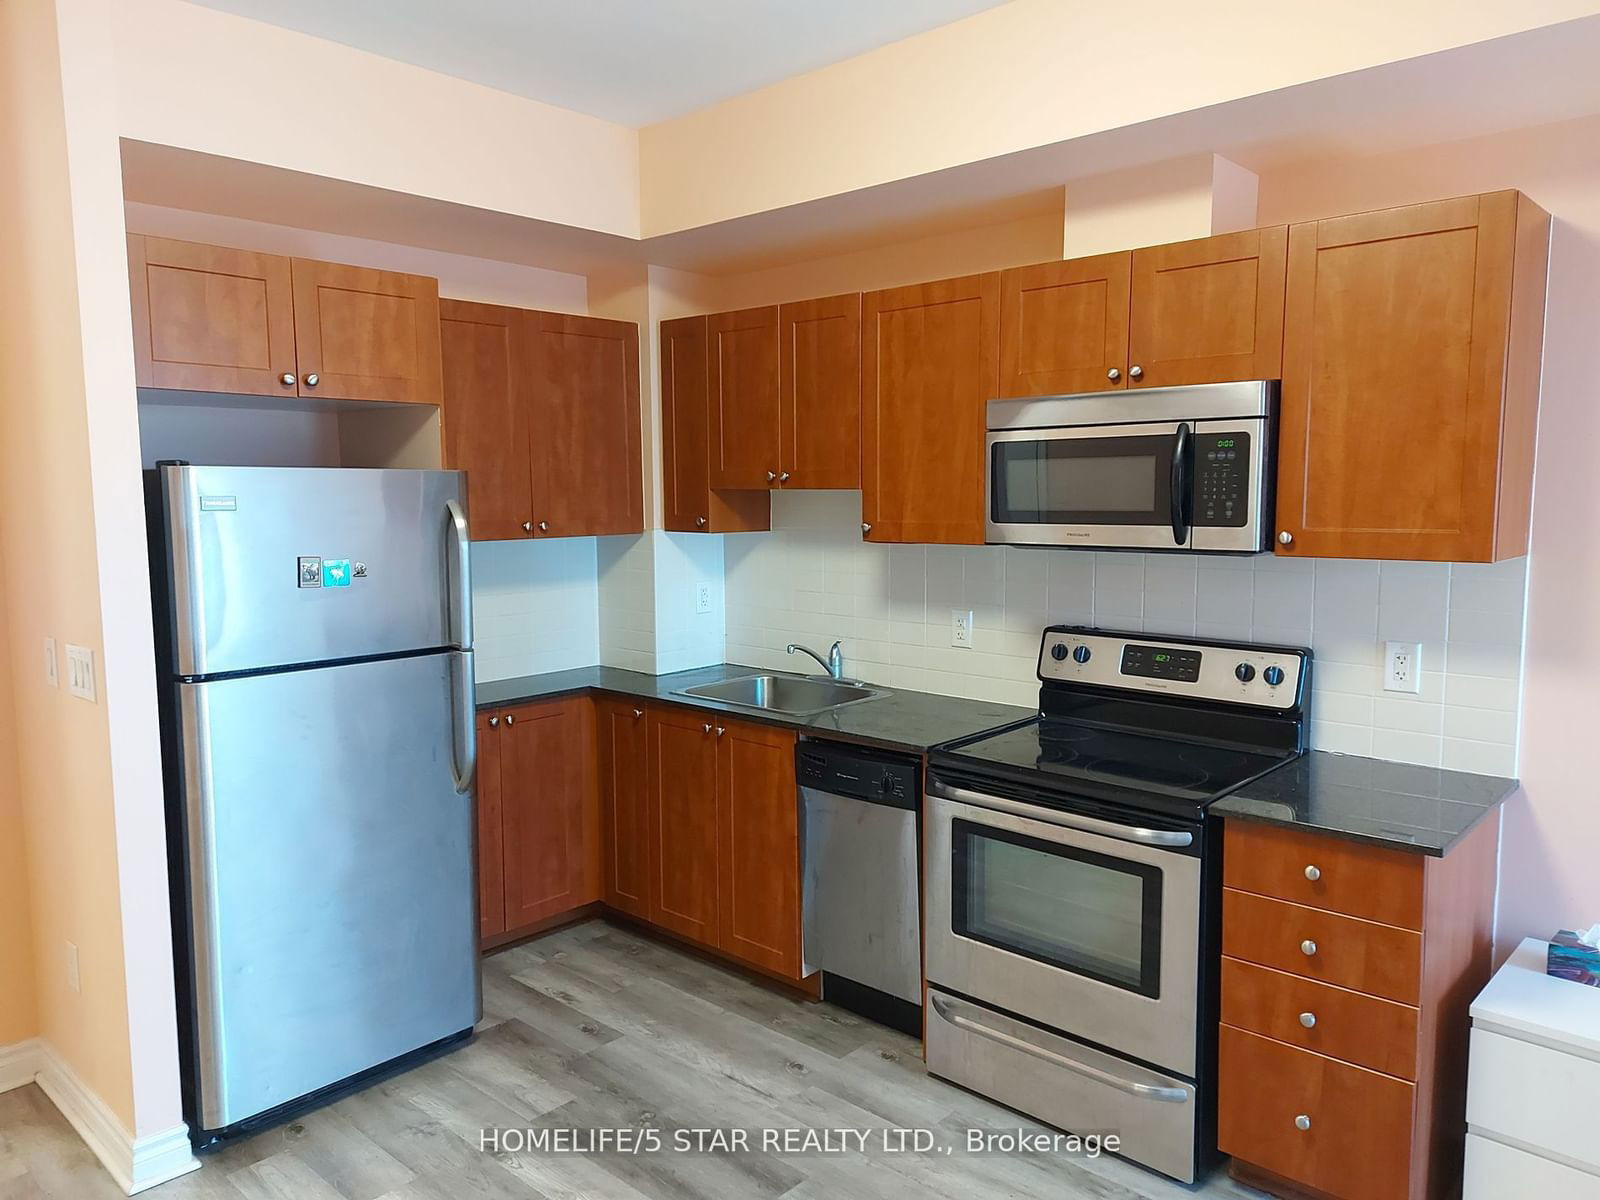
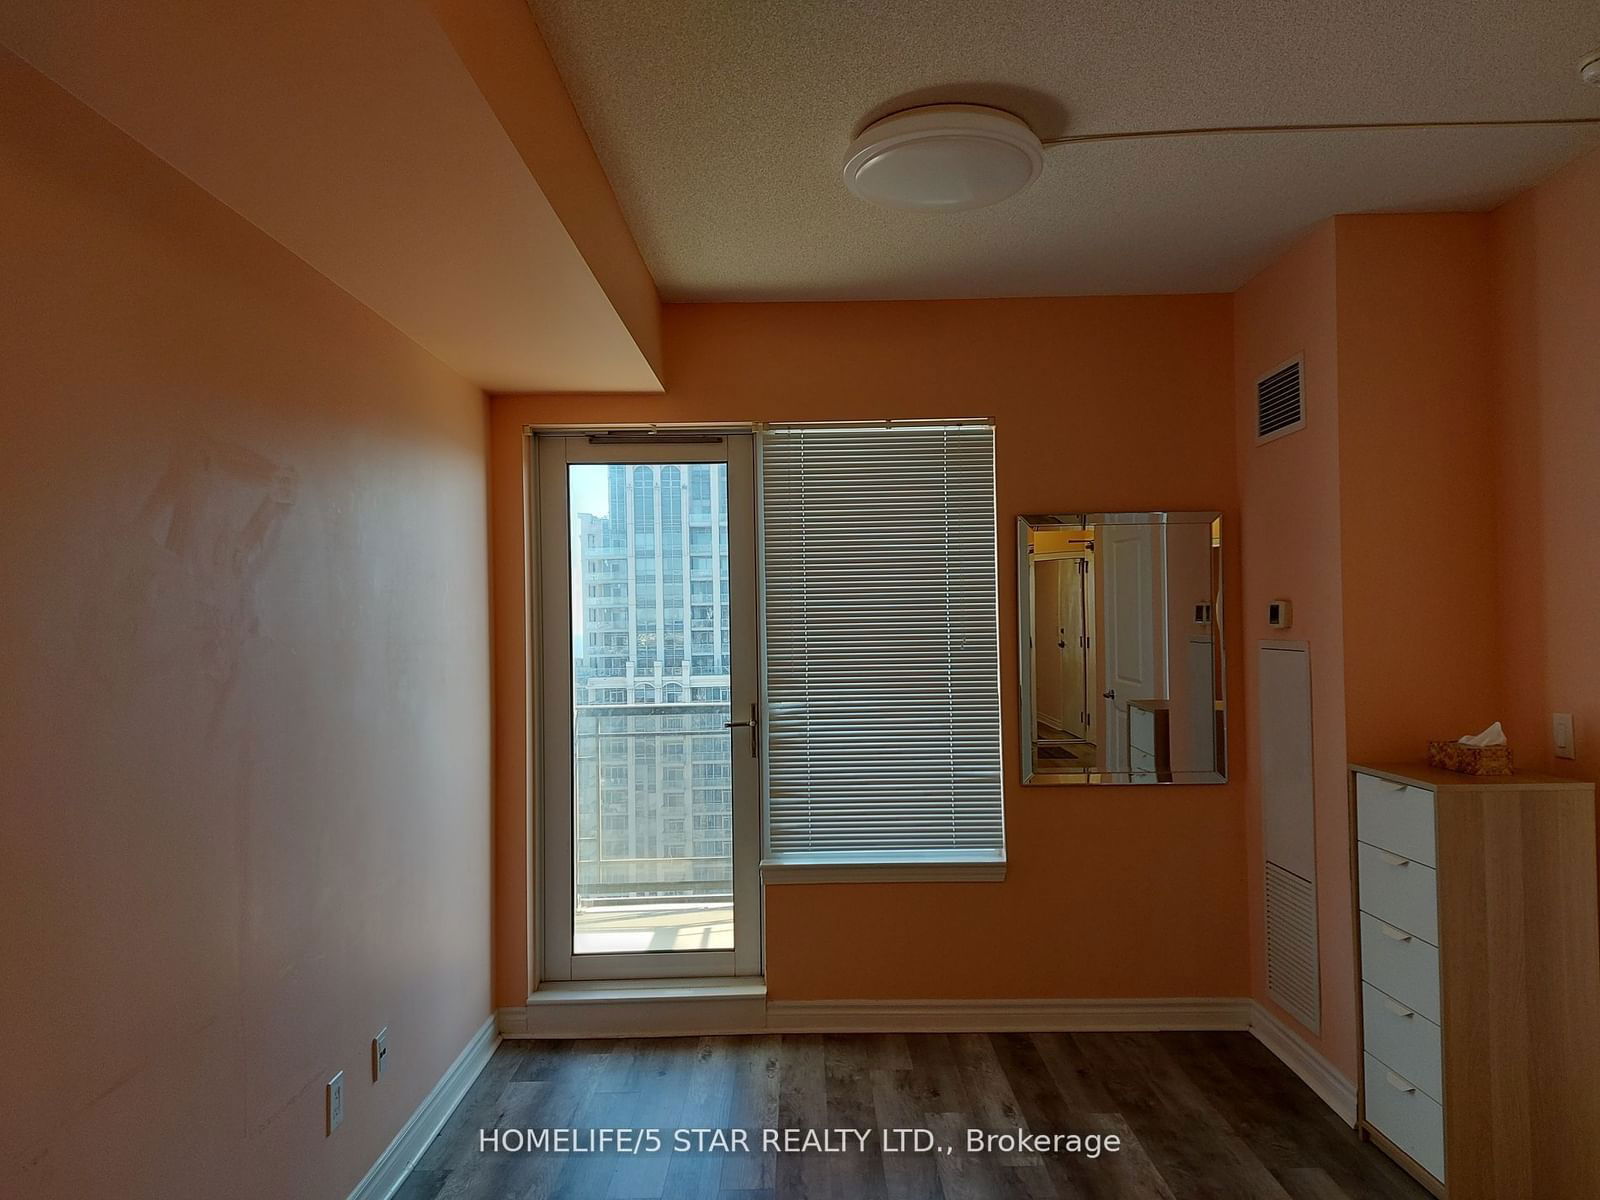
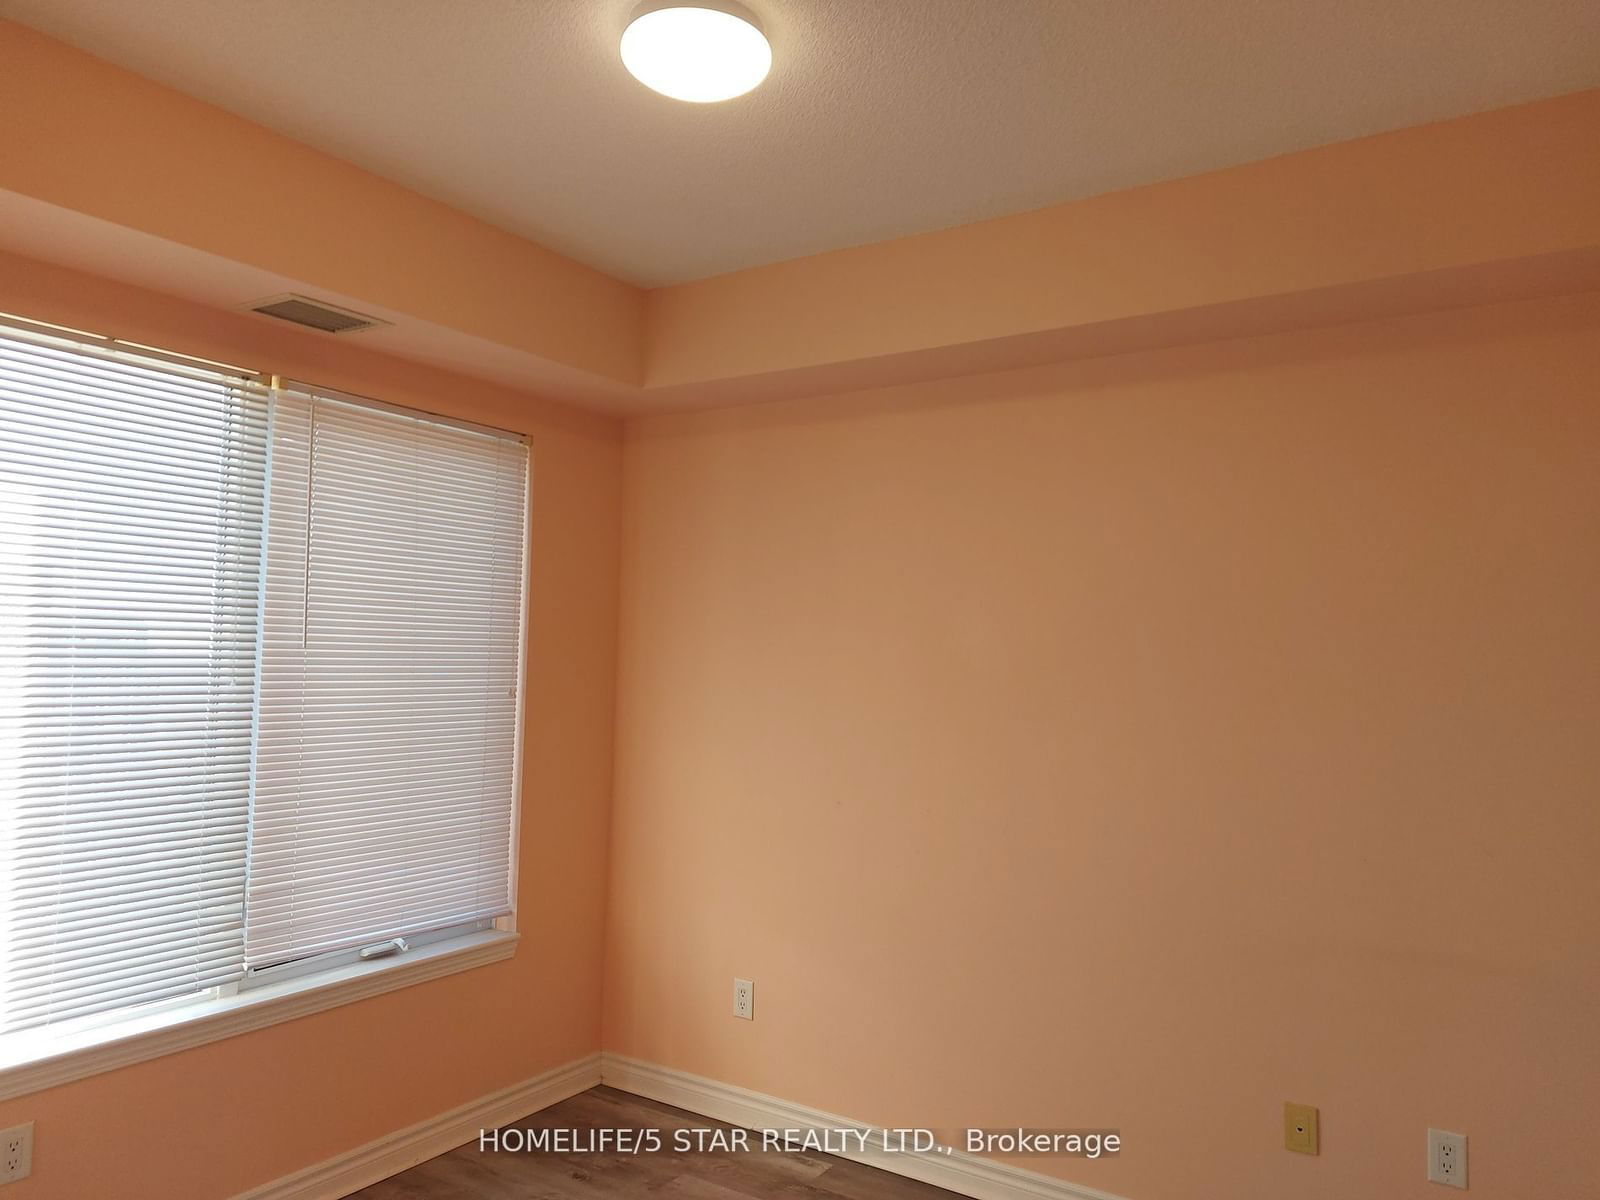
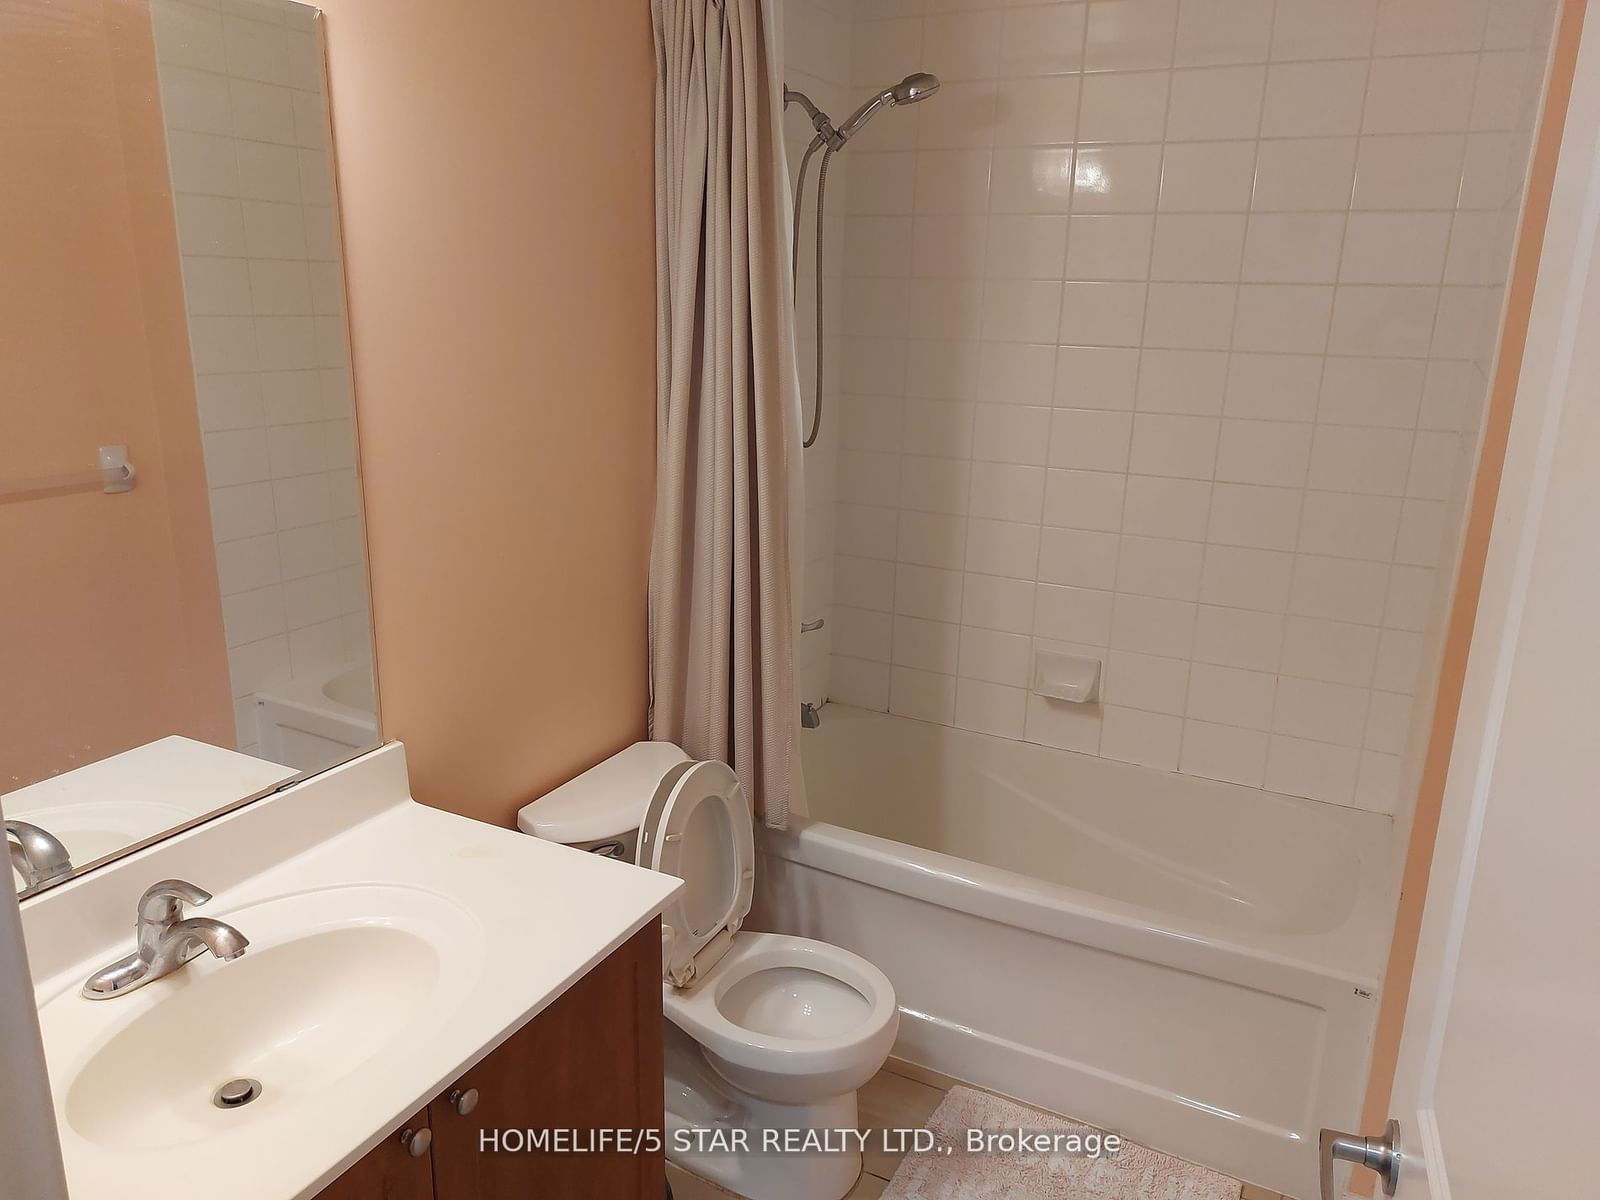
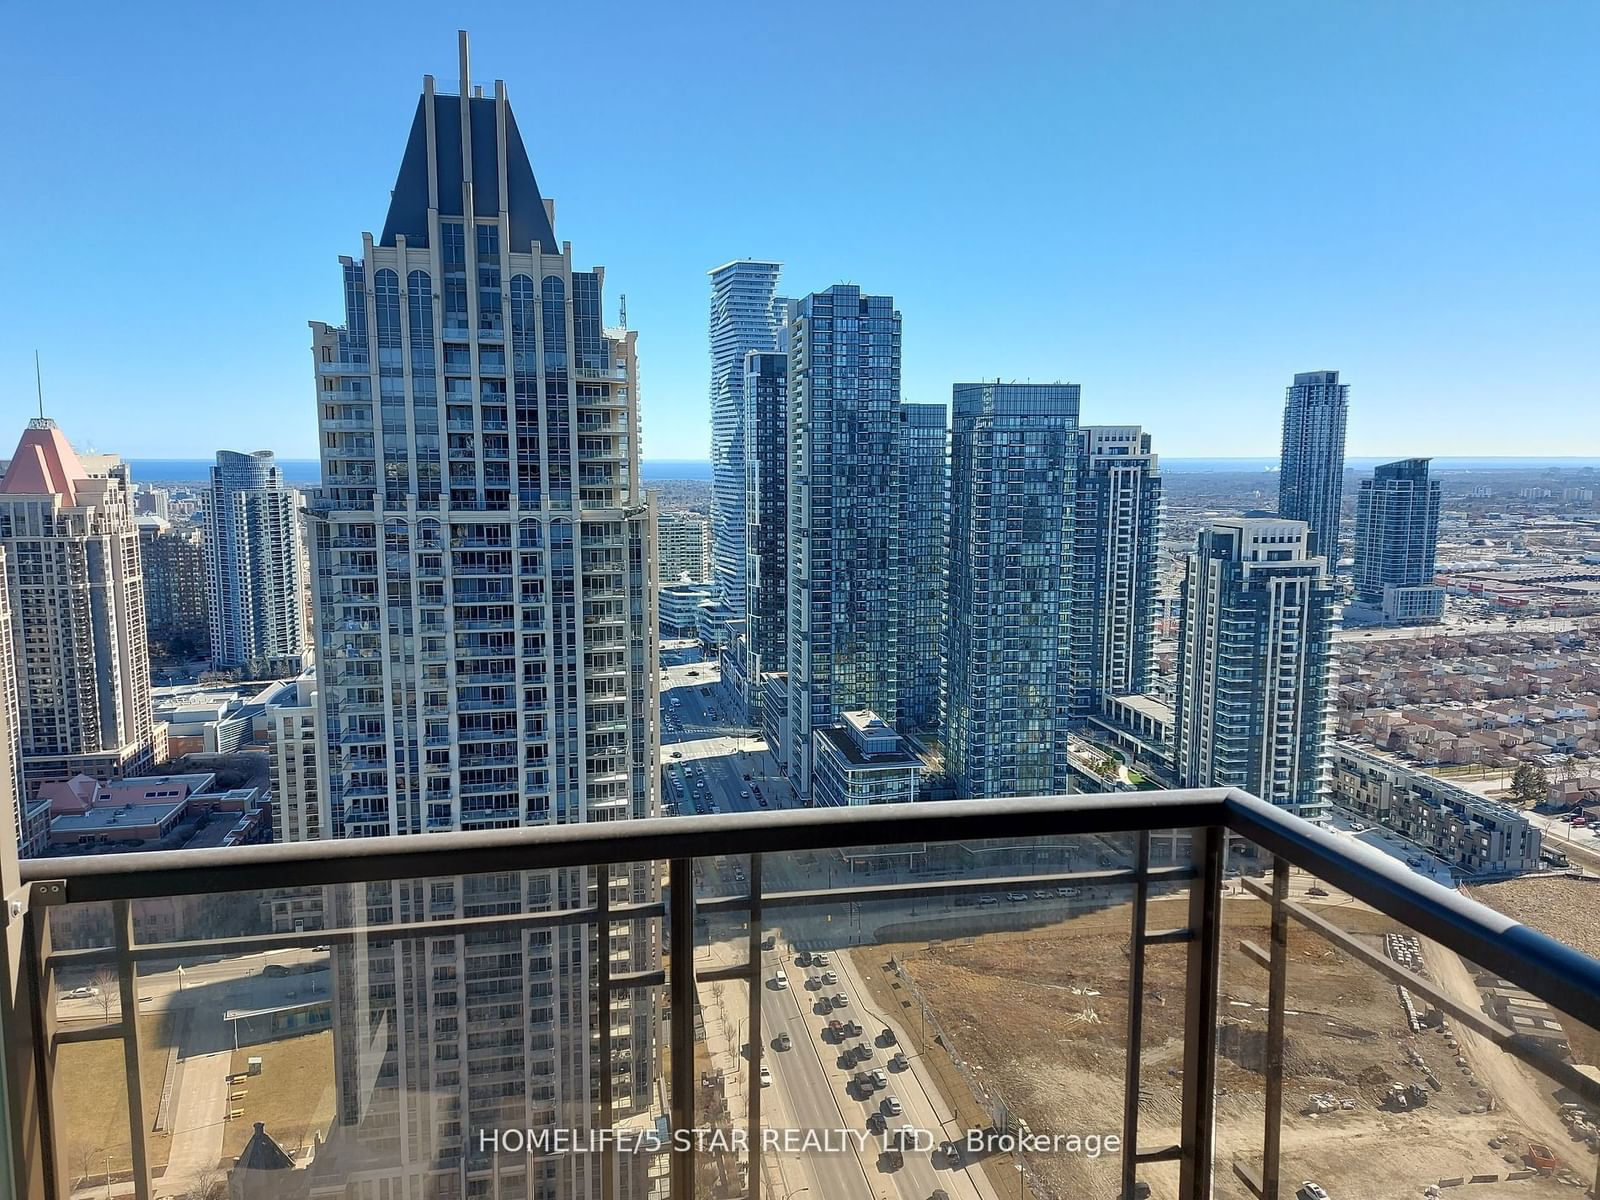
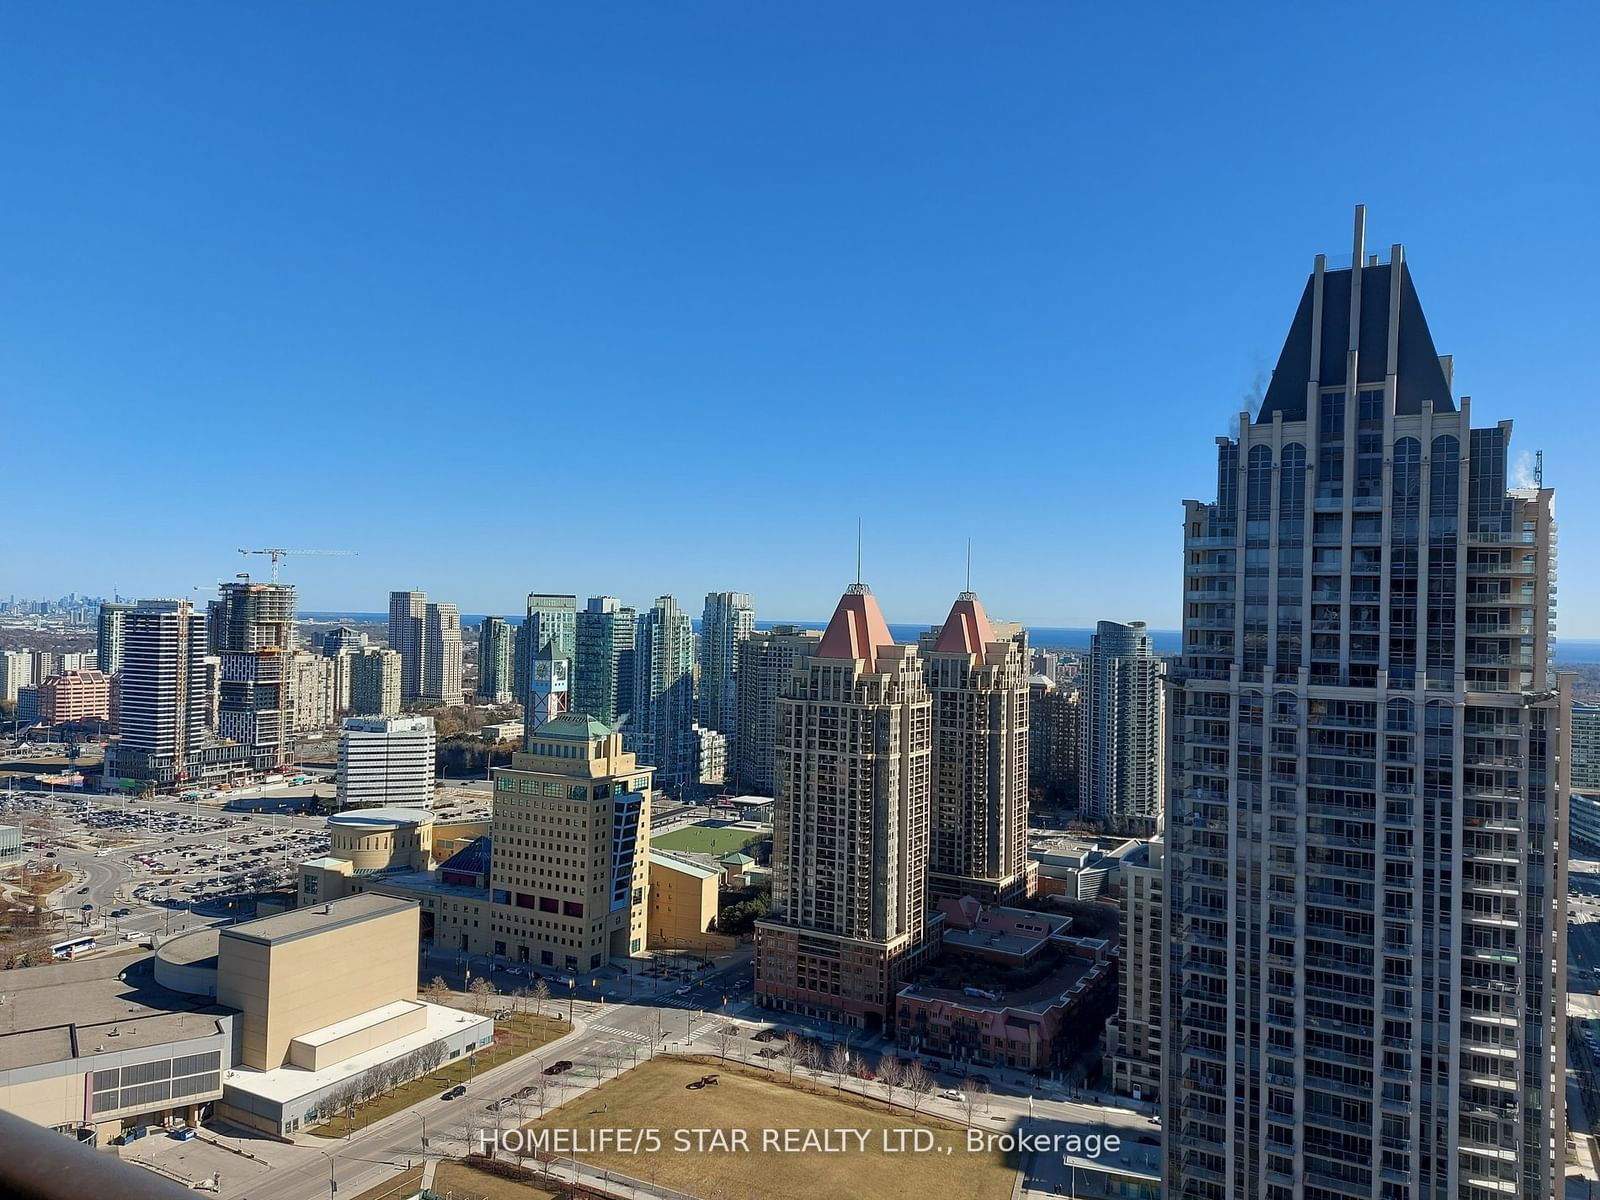
Gorgeous 1Br In State Of The Art Chicago Bldg, Elegant Decor, Gleaming Hwd Floors, 9Ft Ceil, Kitchen W/Granite Counters, 4 Appl, Premium S. View,Balcony O/L City For Miles Away, Amazing Amenities. Tenant Pays For Hydro, Requires Aaa Tenant: Non Smoker, No Pets Allowed,. 1 Yr Lease,Credit Report,Employment Letter &Pay Stubs, Rental App Must Accompany Offer. 1st & Last Month Dep +10 Post Dated Cheqs On Accep Of Offer. Central Miss & Square 1
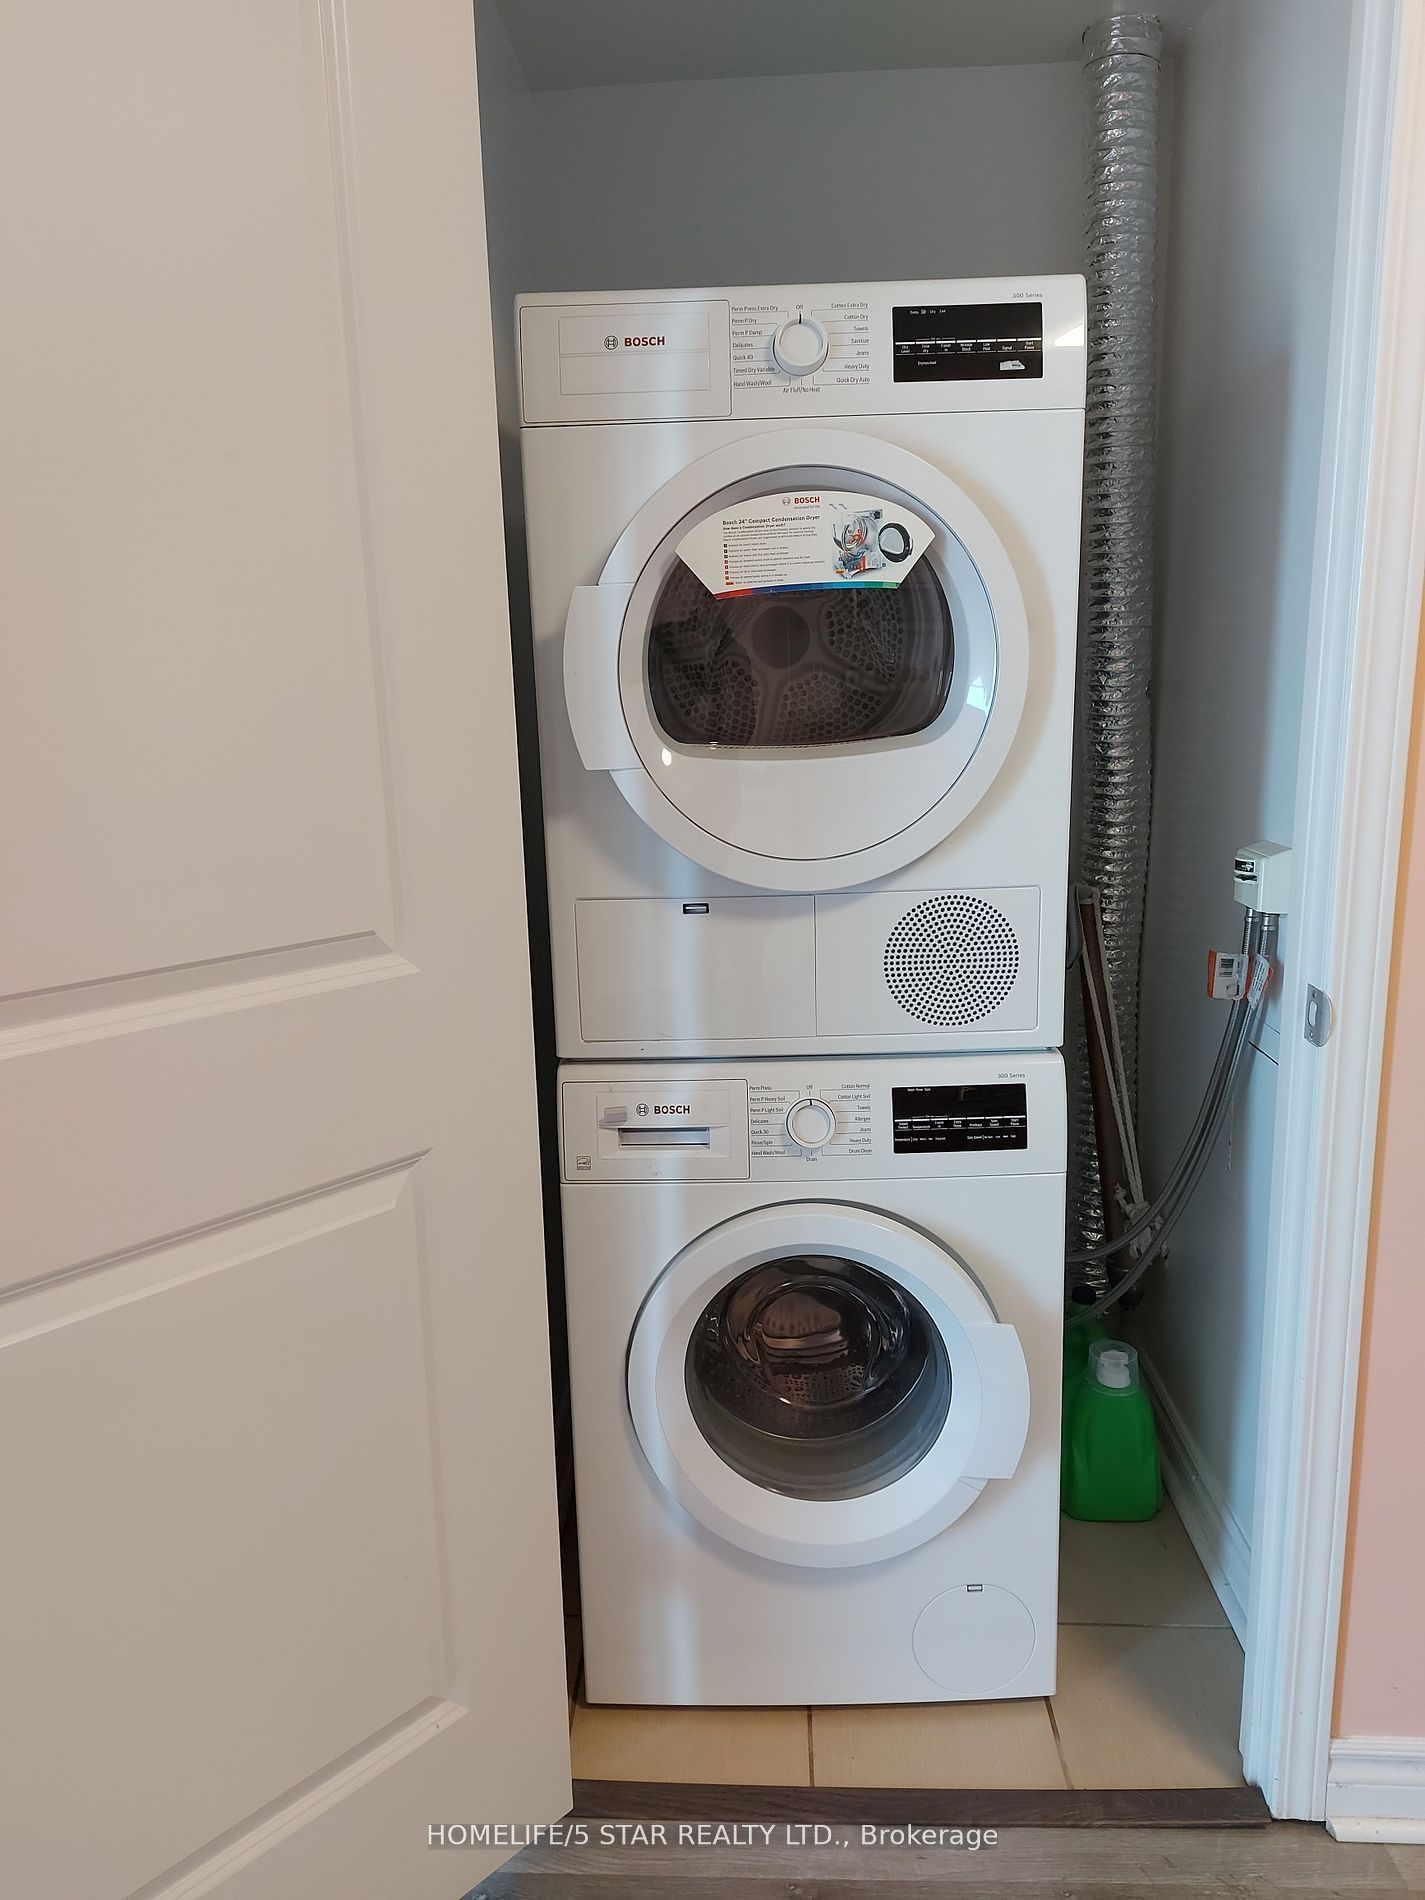
ExtrasS.S. Appl, Fridge, Stove, Microwave, Stacked Washer/Dryer, Great Amenities, Indoor Pool,Fitness Rm,Spa Rm,Leisure Centre,Cinema/Movie Rm,Bbq Area &Patio Common Area-Chicago Bldng.3 Blks Walk To Square 1 &Sheridan College.South Facing Suite.
homelife/5 star realty ltd.MLS® #W11921068
Amenities
Explore Neighbourhood
Similar Listings
Demographics
Based on the dissemination area as defined by Statistics Canada. A dissemination area contains, on average, approximately 200 – 400 households.
Price Trends
Maintenance Fees
Building Trends At Chicago Condos
Days on Strata
List vs Selling Price
Offer Competition
Turnover of Units
Property Value
Price Ranking
Sold Units
Rented Units
Best Value Rank
Appreciation Rank
Rental Yield
High Demand
Transaction Insights at 385 Prince of Wales Drive
| Studio | 1 Bed | 1 Bed + Den | 2 Bed | 2 Bed + Den | 3 Bed | 3 Bed + Den | |
|---|---|---|---|---|---|---|---|
| Price Range | $425,000 - $430,000 | $524,000 - $537,000 | $495,000 - $600,000 | $611,000 - $623,800 | $840,000 | No Data | No Data |
| Avg. Cost Per Sqft | $1,037 | $853 | $814 | $817 | $818 | No Data | No Data |
| Price Range | $1,900 - $2,200 | $2,175 - $2,500 | $2,300 - $2,750 | $2,750 - $3,200 | $2,900 - $3,500 | No Data | $3,600 |
| Avg. Wait for Unit Availability | 159 Days | 24 Days | 24 Days | 76 Days | 125 Days | 1449 Days | 353 Days |
| Avg. Wait for Unit Availability | 57 Days | 12 Days | 11 Days | 49 Days | 115 Days | 369 Days | 113 Days |
| Ratio of Units in Building | 6% | 33% | 38% | 11% | 7% | 2% | 6% |
Transactions vs Inventory
Total number of units listed and leased in Downtown Core
